June 2023: Rate Decision & Economy
The Reserve Bank of Australia ("RBA") has today announced a 25 basis point rise to the official cash rate, after a 25 basis point increase in May.
There are very complicated sets of data for the RBA. In particular, having to balance out the strain of households and the parts of the macro economy, against other stimulating economic factors.
This includes a robust residential property market, and a rise in wage costs following the Fair Work Commission lifting of the minimum wage by 5.75%, the largest increase in some time.
At a time when the Victoria Government's finances are under pressure (see below), and the USA has its "Debt Ceiling" concerns, a recent review of Australia by Fitch Ratings was welcome news. Fitch Ratings believe the economy is in a strong position, at least compared with other developed nations to cope with slowing economic activity. This is seen as being attributable to a healthy level of consumer savings and export opportunities, including China.
For context, the Government's Debt to GDP in the USA is 129%, compared with Australia's 22%.
Economic Sentiment
We are in a holding pattern of sorts. Inflation is expected to fall rapidly as economic conditions begin to bite. Though this is just not manifesting quickly enough, which is good or bad news depending on how you see it.
GDP numbers are out shortly, as the market looks for direction.
Overseas, US Treasury bond yields climbed after their economy showed a tight labour market was sustaining with a warning that the Federal Reserve might not be done with increasing interest rates. The UK had a similar sharp spike in their 2-year rate on the back of soaring inflation.
Victorian Government finances faces "Cliff"
The recent Victorian State budget revealed Victoria’s net debt would continue to rise from $135.4 billion next financial year to $171.4 billion by 2027. This is circa 24.5% of the state's economy.
Data from ratings agency Moody's, and their senior credit officer John Manning, stated that Victoria had managed its debt profile over the past few years like mortgage customers have, by fixing a lot of its debt when the cash rate was at the bottom of the cycle.
"Interest repayments sit at 4.9% of total revenue in 2023, but we project interest costs will become 8% of operating revenue by 2027", said Manning.
This strategy has built a “reasonable buffer for debt affordability”, but with Victoria’s net debt by 2026-27 being over 70% higher than current levels, there are some real concerns. Therefore the Victorian macro position is aligned with many consumers.
RBA Stance
With a rise in May, RBA Governor Dr Lowe was clear on the direction of policy.
“The Board’s priority remains to return inflation to target.” Dr Lowe said. “Inflation in Australia has passed its peak, but at 7 per cent is still too high and it will be some time yet before it is back in the target range. Given the importance of returning inflation to target within a reasonable timeframe, the Board judged that a further increase in interest rates was warranted today.”
The Board also highlighted their awareness of the impact on households, but inflation control will trump.
Shares & Markets
The argument last month around the share market looking expensive had some currency this month. The market is looking closely at earnings, and that will dictate whether investors start taking a less optimistic view of economic prospects.
May was a roller coaster but a weak month overall for the All Ordinaries, and a fall of nearly 3% contains a hint of that sentiment.
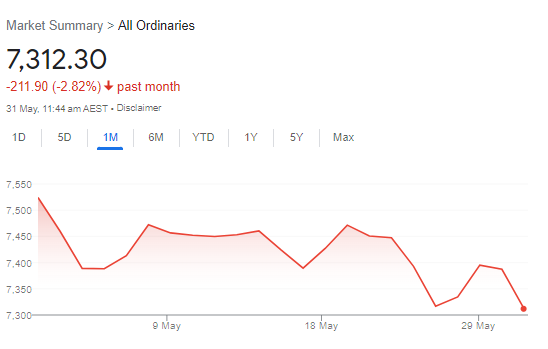
On a global scale, there is another argument that we look cheap compared to overseas equity markets. So who knows.
Direction for Local Interest Rates?
In the war between the market and the economists we have discussed, clearly, the market has got it wrong.
Insights from the ASX Cash Rate Futures, gauging month to month expectations regarding a destination for the peak cash rate. The shape of the curve is very similar, though a sharp increase in expectations (circa 40 points), with the market still conditioned for more rate decreases earlier than economists expect.
This is indicated by the ASX Cash Rate Futures as below.
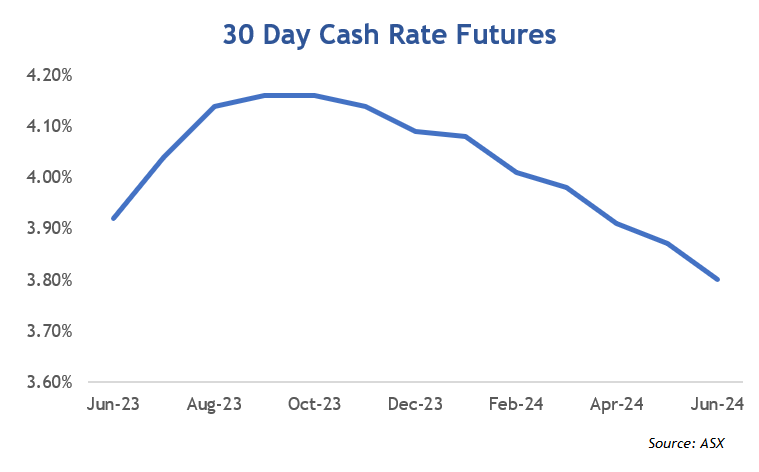
Financial markets still imply that the cash rate will fall over the coming 12 months but off a larger peak. If this concept is confusing, focus on the shape of the curve.
Update for Interest Rates Worldwide
Central banks got a little comfort of sorts, with long-term rates increasing significantly as the world adjusted expectations around interest rate settings.
New Zealand's central bank kept going hard and above expectation with a further 25 point rise in their central rate to 5.50%. They did shock markets, however, indicating they are likely done raising the cash rate, citing a weaker property market, and slowing consumer spending. Their strategy leads one of the most aggressive tightening cycles across developed economies. This should be an excellent case study fodder for the future economists.
In the UK, the Bank of England moved with another 25-point increase to 4.50% at their May meeting and a 12th consecutive rise. Governor Andrew Bailey from BoE had sobering words, “Let me be clear, inflation remains too high. We have to stay the course to make sure inflation falls all the way back to the 2% target."
The U.S. yield curve is still inverted, with medium and long term rates falling. The Federal Reserve raised interest rates by another 0.25% in May as it continued its inflation fight. Inflation has steadily declined this year but remains well above their target rate of 2.0%.
In Canada, Inflation is still stubborn and there is a chance they will increase their rate from its current 4.50% when they meet this week. Increasing longer term rates at least made the yield curve a little flatter.
In the Eurozone, rates increased for the seventh increase in a row, though at 0.25%, it was the smallest in the current cycle.
Before posting any changes today, we compare central bank cash rates and their longer term 10 year bond yields.
There was a lot of action last month, though generally at all ends of the yield curve with increases in short-term money matched by longer term. The spread in most countries remains inverted, but the level was relatively stable.
|
Country |
Cash Rate | 10 Year Bond | Spread |
|
Australia
|
3.85% | 3.74% | -0.11% |
|
Canada
|
4.50% | 3.26% | -1.24% |
|
China
|
3.65% | 2.73% | -0.92% |
| Germany | 3.75% | 2.33% | -1.42% |
| India | 6.50% | 6.98% | 0.61% |
| Japan | -0.10% | 0.41% | 0.51% |
| New Zealand | 5.50% | 4.38% | -1.12% |
| Singapore | 3.72% | 2.90% | -0.82% |
| United Kingdom | 4.50% | 4.15% | -0.35% |
| United States | 5.25% | 3.70% | -1.55% |
This generally implies that the market has higher rates expectations going forward, though it still sees relatively weak economic conditions in the longer term.
Local Money Markets
Australian money markets were active and yields rose across all terms. The May 25-point rise was against expectation and was an immediate uplift across all terms.
| Month | Cash Rate | 180 Day | 10 Year |
|
Jul 22
|
1.35% |
2.70% |
3.54% |
|
Aug 22
|
1.85% |
2.78% |
2.96% |
|
Sep 22
|
2.35% |
3.04% |
3.65% |
|
Oct 22
|
2.60% |
3.55% |
3.90% |
|
Nov 22
|
2.85% |
3.61% |
3.74% |
|
Dec 22
|
3.10% |
3.48% |
3.48% |
|
Feb 23
|
3.35% |
3.67% |
3.50% |
|
Mar 23
|
3.60% |
3.94% |
3.85% |
|
Apr 23
|
3.60% |
3.81% |
3.30% |
|
May 23
|
3.85% |
3.82% |
3.34% |
|
June 23
|
4.10% |
4.21% |
3.65% |
Nothing like a surprise rate rise to jolt markets! All parts of the curve went up to what we are told is the new base. The 180-day rate rose sharply based on changed expectations about the direction of interest rates.
It will be good to watch these forward rates to see if the market has overshot its expectations of lower interest rates.
Residential Property
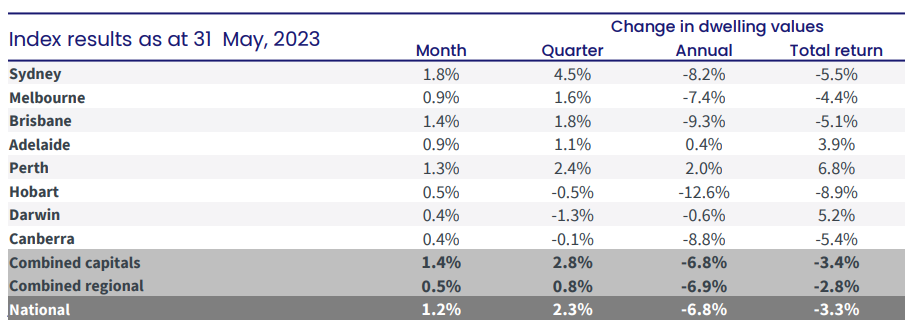
The latest residential monthly property results from CoreLogic showed home values up over 1% nationally in May 2023, which was the strongest result for some time.
These results are on the back of limited supply, so it will be interesting to see if vendors have the confidence to test the market.
Sydney led the overall increase and the subtle swing from regional areas to capitals continues.
Commercial
Valuations in commercial offices have been more stubborn than expected, though this has largely been off the back of limited transactions or timing on updated valuations.
There are now some transactions crystallising and valuations are showing falls based on higher capitalisation rates. A definite watch over the next year.
Currency
The Australian dollar dropped to the lowest level since November last year to circa US65¢. The AUD was a little stronger though with all major currencies and the trend over the past year is still a weak one as shown in the table below.
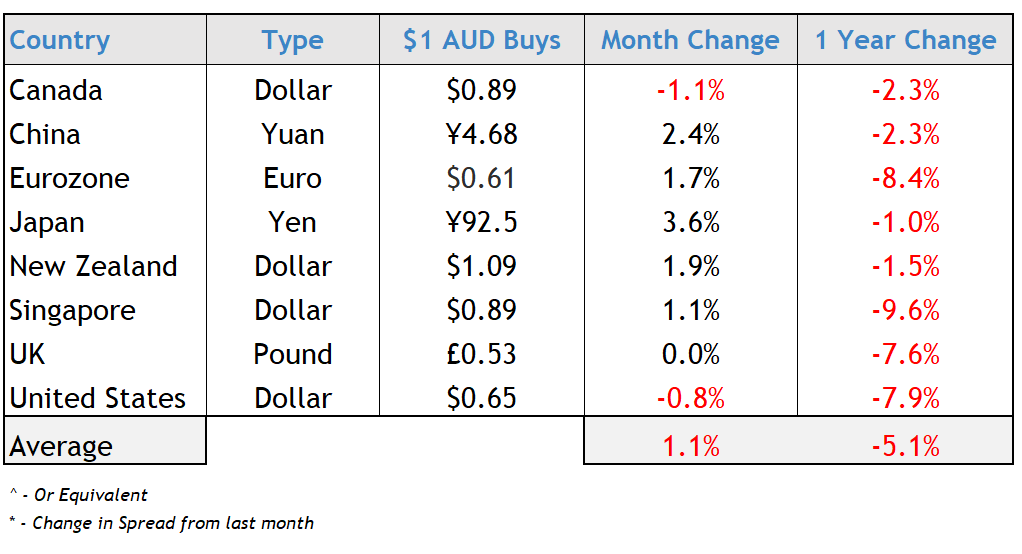
These trends are challenging for the RBA. While we have discussed here the benefit of a weaker currency for our exports, in the short-term it can typically add to inflationary pressures by making non-discretionary imports more expensive.
We wish you a prosperous start to winter.