


It's 2026, and global government debt is climbing. How does Australia's position compare?
Global public debt is expected to exceed 100% of GDP by 2029 for the first time since the Second World War. Corresponding political and economic commentary increasingly points to this as a genuine risk factor for the years ahead.
Should Australia be worried? The initial comment is perhaps not so much.
Comparing other countries, Australia’s government balance sheet remains one of the strongest in the developed world. It is the cost of that debt that is felt in our economy, more than the size of the debt. More broadly, much of Australia’s leverage actually sits with households. That is what makes Australia somewhat unique, and, importantly, vulnerable.
IMF projections & rising interest costs
In 2025, global public debt sat at 93.9% of GDP. The IMF expects it to cross 100% by 2029 and reach 102.3% by 2031.
Advanced economies are driving the trend rather than the emerging ones, with advanced economy debt projected to climb from 108% of GDP in 2025 to 114.8% in 2031.
The IMF's April 2026 World Economic Outlook and its companion Fiscal Monitor keep the growth of Government debt on the agenda, as shown in the figures below.
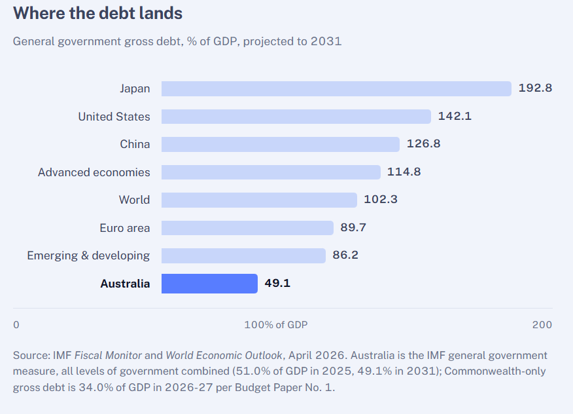
Looking behind that average shows the following:
-
Japan — still the outlier at 206.5%, though on a slowly improving path toward 192.8%.
-
United States — public debt rising to 142% by 2031, with the general government deficit deteriorating to 7.5% of GDP in 2026 and interest payments alone consuming 4.3% of GDP.
-
China — headed for 126.8% by 2031, with a true deficit closer to 8% of GDP than the official 4%.
-
Euro area — comparatively restrained at 87.1%, drifting to 89.7%, with sixteen EU member states activating escape clauses from their own fiscal rules to fund defence.
Refinancing the future
Arguably the more telling figure is global interest costs, which have risen from 2% to nearly 3% of global GDP in just four years. Governments have not borrowed that much more (well, comparatively speaking), but they have refinanced what they already owed at a materially higher price.
How does Australia’s debt compare?
Against that backdrop, Australian Commonwealth gross debt is forecast at $1,051 billion in 2026-27. This is reflected as 34.0% of GDP, peaking at 35.9% in 2028-29 before declining to 27.2% by 2036-37. Net debt is 19.9% of GDP.
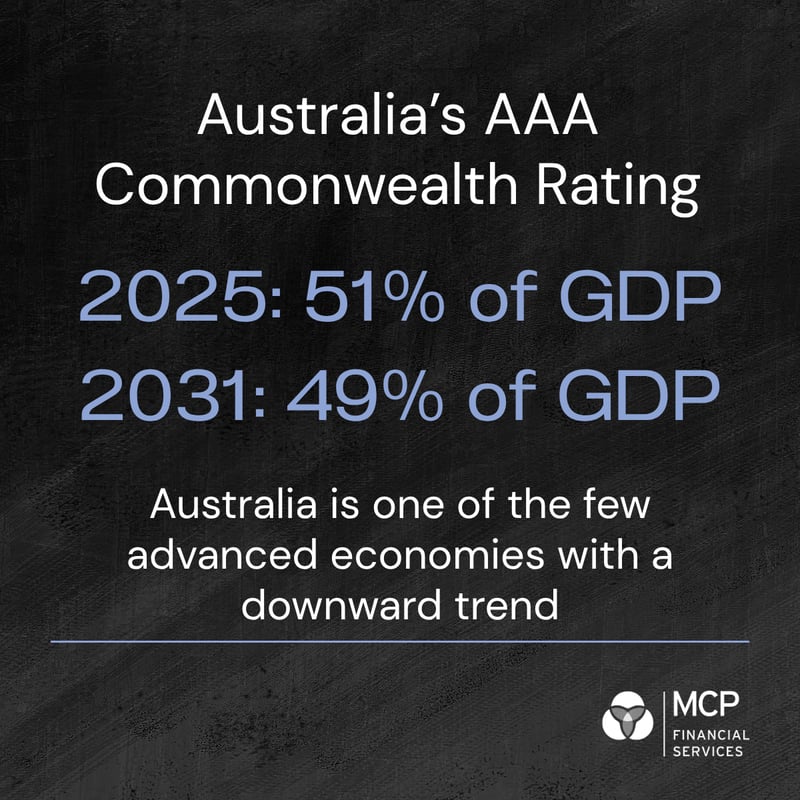
General government debt is the measure the IMF uses for international comparisons. When our states and territories are added, this measure sits at 51.0% of GDP in 2025, easing to 49.1% by 2031. As a result, Australia is one of the few advanced economies the IMF sees trending down over the decade.
Against an advanced-economy average of 108% rising to 114.8%, that is a comparatively comfortable position. Australia retains its AAA rating at the Commonwealth level, and on the IMF's own framing, we sit on the favourable side of nearly every comparison in the report.
The flow-on price of debt
While the level of debt itself is not the main concern, there are three other pressing aspects that require attention.
1. It’s the cost of the debt, not its size
Australia's 10-year government bond yield has risen over 5.20%, its highest in more than 15 years. UK and German borrowing costs have also reached multi-year highs and Japan is rising out of decades of low interest rates. The issue being that this change seems more structural and here to stay for the immediate future.
A bond yield is essentially the rate that investors want for lending, and more risk seeks a higher return. Governments need more money to invest in a lot of things (technology, defence, etc.) and the market is making them pay more to get it.
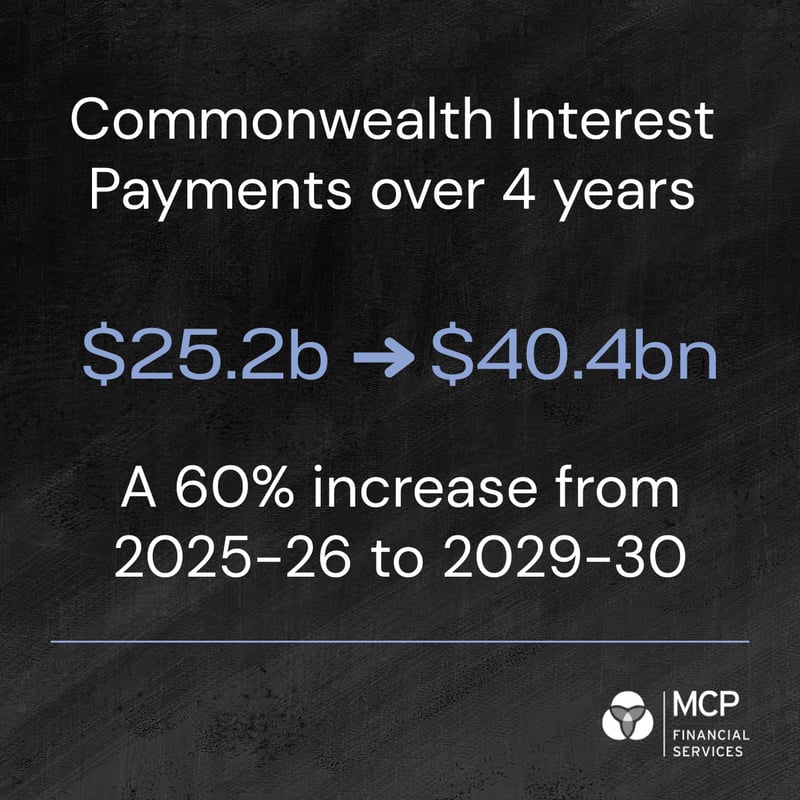
The weighted average cost of borrowing on new Treasury Bond issuance is around 5%, up from 2.2% in 2022. This is the same mechanism the IMF flagged globally, playing out locally, and interest is the least productive line in any budget.
2. The State debt position
The AAA rating at the Commonwealth level sits alongside a weaker position one level down. EY reports that combined federal and state debt is projected to be roughly $67,000 per Australian resident by FY29. Combined state and territory general government gross debt is projected to exceed $720 billion by FY29.
As it stands today:
-
Western Australia is the only state still rated AAA
-
Victoria is headed toward $300 billion, with an interest bill approaching $10.5 billion a year and has already been downgraded – along with the ACT. Victoria, ACT and Tasmania are now rated AA.
- Queensland, whose credit rating dropped to AA+ in 2009, was downgraded to AA in September, due to rising costs related to transport, energy, healthcare, and infrastructure for the 2032 Olympics and Paralympic Games, causing projected total debt to reach over $216 billion by 2029-30.
-
New South Wales has passed $250 billion and carries a negative outlook on the current AA+. South Australia's AA+ is intact for now.
There are direct commercial consequences at play. When states cannot borrow cheaply, they tend to raise revenue instead via payroll tax, land tax & property tax. Sound familiar?
Structuring decisions made today would sensibly allow state revenue measures to become firmer rather than easier.
3. The leverage sits with households
Australia's public balance sheet looks good in part because the private one carries more of the load.
Household debt sits at around 112% of GDP, making it the second highest in the world, behind Switzerland. That is the channel through which global bond market repricing reaches Australian households and businesses.
Repricing is already underway - the Australian 10-year bond yield is above 5%, up almost 1% over a year, and the cash rate sits at 4.35% after three RBA increases in February, March and May. The Governor has consistently signalled that more rises are "quite possible".
We will explore the impact of this on Australian households in Part 2.
How borrowers can plan ahead
There are four practical considerations for Australian borrowers:
-
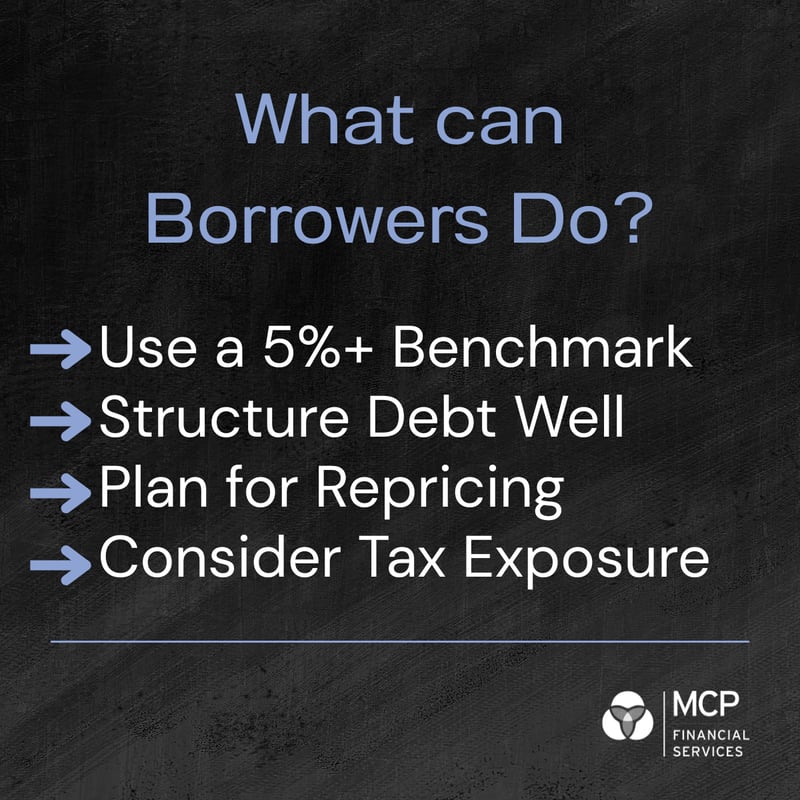
Revisit the hurdle rate. Capital expenditure decisions modelled against a lower risk-free rate are worth reworking. A 5%+ benchmark is a more realistic test in the current environment.
-
Consider debt structure deliberately. With the market pricing further tightening, debt structures need proper planning. How much, for how long, variable or fixed commitments
-
Review covenant headroom early. Facilities written in the cheap-money era are rolling into a materially different pricing environment. Identifying pressure early leaves more options open.
-
Allow for sustained tax pressure. Tax exposure deserves a look at any restructuring, acquisition or property decision.
The bottom line
Australia has no material cause for concern about the size of its government debt. By the IMF's own April 2026 numbers, we are among the more conservatively positioned advanced economies in the world.
The areas that do warrant attention are the cost of that debt, the widening gap between an AAA-rated Commonwealth and increasingly stretched states, and the fact that our real leverage sits in household and business balance sheets, where higher-for-longer rates are felt most directly.
Lastly, countries need to keep funds in reserve for when the inevitable economic shock hits.
> Next month: Australia's Debt Part 2 - Households & Property: How Australia's income problem affects household budgets
Contact MCP
1300 510 816 or your Finance Partner
enquiry@mcpfinancial.com.au
This article is general information only and does not consider any person’s objectives, financial situation or needs.
Sources: IMF Fiscal Monitor, April 2026 — Fiscal Policy under Pressure: High Debt, Rising Risks; IMF World Economic Outlook, April 2026 (Australia's general government gross debt of 51.0% of GDP in 2025 and 49.1% in 2031 taken from the IMF DataMapper WEO / Fiscal Monitor database, April 2026 vintage); Australian Government Budget 2026-27, Budget Paper No. 1, Statement 7 (Debt Statement); EY Australia state fiscal analysis; Trading Economics market data as at 26 August 2026.