


Key Takeaways
- RBA raises cash rate to 4.85% - the highest since 2008
- Watch List: CPI, Oil, Bond yield rates, Global rate decisions
- Borrowing capacity is tighter heading into the spring property market
Economy & Property Market Watch - November 2026
Cash Rate Decision
Thanks for reading our seventh Economy & Property Market Watch for 2026.
The RBA has raised the cash rate to 4.85% at the November meeting today. This is the fifth increase for 2026 and the second in a row, which takes the cash rate to its highest level since late 2008.
After last week's September quarter inflation data, markets priced the move at close to 90%, up from about 60% before the release.
The case for a rise had strengthened over the past month. In mid-October, Deputy Governor Hauser warned that the inflation outlook was "materially worse" and that some businesses were beginning to see inflation of 3–3.5% as normal. On CPI release day, Governor Bullock said upside inflation risks were emerging and inflation was likely to exceed the Bank's August forecast. Many in the industry have described today's move as an "insurance hike".
The Scorecard
"The Scorecard" is updated with available data as of 30 October 2026. The 'Previous (September)' column reflects the starting position at the last edition.
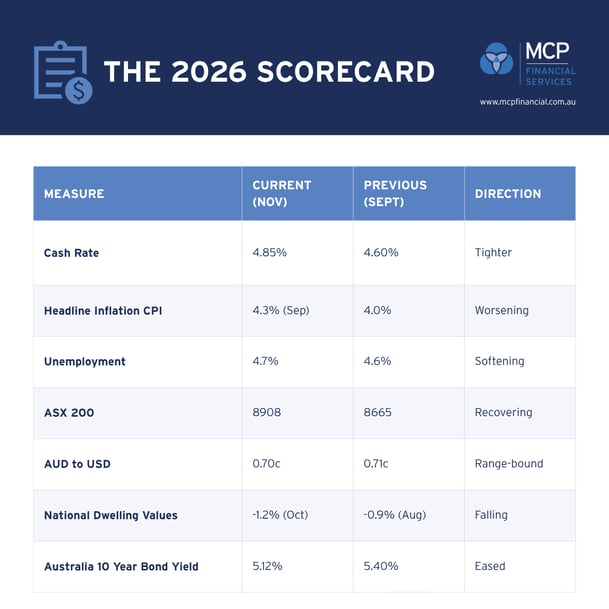
In summary, inflation worsened, and the economy weakened. Headline and core inflation, inflation expectations and oil all moved the wrong way. Confidence, sentiment, house prices and auction results all softened. That combination is why the RBA moved today even with unemployment drifting up.
Interest Rates, Inflation & RBA Matters
Today's 0.25 rise adds around $95 a month to repayments on a $600,000 loan with 25 years remaining. Across the five increases this year, the same loan now costs roughly $465 a month more than it did in January.
Inflation worries
Trimmed mean inflation rose 1.0% in the quarter, above the RBA's own August forecast of 0.8%. That kept annual underlying inflation at 3.6%.
Headline inflation was worse. Annual CPI rose to 4.3% in September from 4.0% in August, beating expectations, with a 0.8% rise in the month alone. Fuel, electricity and new dwelling prices led the increase. Automotive fuel rose 9.4% in the month and was excluded from the trimmed mean, which explains most of the gap between headline and core.
Expectations are now the bigger worry. The Melbourne Institute measure of consumer inflation expectations jumped to 5.3% in October from 4.9%, its highest since June. In September we noted that once households expect inflation near 5%, it becomes harder for the RBA Board to look past it. They now expect more than that.
A softer labour market
The unemployment rate rose to 4.7% in September, with employment falling 39,300. The detail is more mixed than the headline. Full-time employment rose 34,400, while part-time employment fell 73,700, and participation eased to 66.8%. In trend terms, unemployment held at 4.6%.
The RBA has said it now sees the labour market as a little tighter than it previously judged, despite the rise in unemployment. A softening labour market is still not enough to offset an inflation problem that is being fed from outside the economy.
Looking to December
The RBA’s final meeting for 2026 is on the 8th December. Key measures to watch are:
- The October CPI, released in late November, and the October labour force on 19 November.
- Oil - Brent finished October up 13.6% and settled at a six-month high, with fresh attacks on shipping around the Strait of Hormuz. Goldman Sachs puts the range at US$80–120 depending on whether Gulf exports normalise or attacks escalate.
- Some expect interest rate holds in December and February, with cuts pencilled in for later in 2027. The Australian 2-year yield was around 4.90%, suggesting the market sees little beyond 4.85%.
For borrowers, our read is now "at or near the peak, but higher for longer". Plan household and business budgets on today's rate holding well into 2027.

SME Business Conditions
Business confidence has fallen for a third consecutive month. In NAB's September survey, confidence fell 4 points to -13. That is 18 points below its long-run average and in the bottom 5% of readings in the survey's history. NAB described a "triple squeeze" of higher interest rates, global uncertainty and elevated fuel and diesel costs.
Conditions held at -1. Small rebounds in trading conditions and profitability were offset by a 3-point fall in the employment index to its lowest level in five years. NAB's quarterly survey was weaker still: conditions fell to -2, the first negative reading since September 2020, and sales margins hit their lowest level since June 2020.
Capacity utilisation remains above average at 82.3%, indicating that businesses are busy, but at thinner margins. For lenders, that means revenue that looks healthy and cash flow that doesn't.
On a $1 million variable business facility, today's rise adds about $2,500 a year in interest. The five rises this year add about $12,500 a year. For a business whose earnings are flat and whose fuel and wage costs are not, the difference comes straight off interest cover.
Our message for business borrowers: test covenant headroom and interest cover at today's rate, review working capital limits before the Christmas cash-flow trough, and raise any pressure with your lender before annual review rather than at it.
Commercial Property Trends
The funding backdrop moved in two directions in October. The cash rate rose, but long-term yields eased. The Australian 10-year bond yield fell to 5.12% by 30 October, down 0.28% over the month, although still about 0.8% higher than a year ago. With the cash rate now at 4.85%, the gap between the cash rate and the 10-year yield has narrowed to about 0.27%.
That gives some relief on valuations, because cap rates take their cue from longer yields, but none on servicing. Borrowing costs on secondary assets now sit well above the income yields on many of them. The commercial debt deals that work are the ones where rent covers interest at today's rate, with headroom.
Industrial and well-located logistics assets with quality tenants continue to hold up as solid commercial investments. Secondary office remains the weakest segment. In retail, tenant covenant strength is still the key differentiator. For developers, the cost side has not eased: non-residential building prices rose 1.7% in the latest producer price data, ahead of 1.0% for house construction, with skilled labour shortages and data centre demand cited.
In September we suggested stress-testing deals at a 4.85% cash rate. That is now the actual rate. Our updated guidance is to stress-test at 5.10%, and to treat any assumption of rate relief before the second half of 2027 as upside rather than base case.
Property Insight - Western Sydney Industrial
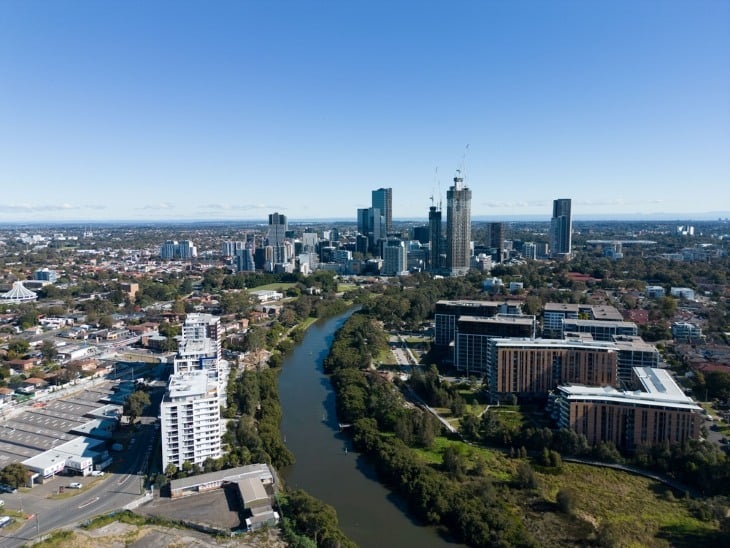
Western Sydney took a record 78% of Sydney’s industrial investment volume ($5.8 billion) in the year to September. Outer West total returns reached 14.3% in the year to June, although that momentum is expected to moderate as softer yields reach valuations.
For now, Western Sydney’s industrial market is holding its ground, but rate rises are now flowing through to pricing.
-
RWC Western Sydney’s October 2026 report shows yields have softened 35 to 55 basis points over the year across the region’s four precincts.
-
Average prime yields now sit between 5.50% and 5.75%, and the tightest yields have lifted to 5.00%, their highest level since early 2020.
-
The gap between the best and weakest assets has widened to as much as 300 basis points. Modern, well-leased logistics facilities are holding value, while older buildings on short leases are softening the most.
-
Prime face rents have been flat for two years at $182–$230/sqm, with incentives above 20%. The development pipeline has contracted 39%, pointing to a shortage of modern stock leading into 2027–28.
How Sydney compares
Sydney remains among Australia’s tightest-yielding industrial markets, but its yields are softening faster than those of the other capitals. Melbourne is the closest comparison where prime yields average around 6.0%, and prime capital values have slipped during 2026.
Brisbane, Perth and Adelaide are where occupier momentum sits, with Brisbane prime rents up more than 10% over the year to June and Perth vacancy down to 1.0%. In the September quarter, rents rose 2.1% in Adelaide and 1.5% in Brisbane, against just 0.1% in Sydney.
What it means for borrowers
• Investors buying or refinancing older or secondary assets should expect valuations to reflect softer yields and effective rents rather than headline rents. Build this into LVR and serviceability planning early.
• Owner-occupiers and private investors remain active in smaller units in the Inner Central West and North West, where scarcity is supporting values.
• Lease quality and building standard carry more weight than ever in valuation and credit outcomes.
More guidance can be found in our updated NSW Property Guide.
Sources: RWC Western Sydney, Western Sydney Industrial, Issue 6 (October 2026); CBRE, JLL and Knight Frank industrial research (2026).
Residential Property Outlook
National home values are now lower than a year ago for the first time in this downturn. Cotality's national Home Value Index fell 1.2% in October, the seventh consecutive monthly decline. That takes annual growth to -2.8% and leaves national values about 6.3% below the March peak. The national median value is now $885,000.
The mid-sized capitals are falling fastest. Brisbane recorded the sharpest decline again, down 2.0% in the month and 6.1% over the quarter, and its annual growth has almost disappeared at just 0.4%. Perth fell 1.7% (-5.7% over the quarter) and Adelaide 1.2%. Sydney's decline accelerated to -1.6%, with values down 9.4% over the year and around 10% below the February peak. Melbourne remains the mildest of the large capitals at -0.8%. Hobart (+0.5%) and Darwin (+0.6%) were the only capitals to rise.
Rental income is now doing almost all the work. Including rent, the national total return over the year was just 0.5%, and combined capitals were negative at -1.6%. Sydney (-6.5%) and Melbourne (-4.1%) investors have gone backwards over the year even after rent. Regional markets remain the relative safe harbour, down 0.7% in the month but still up 3.4% over the year, with a total return of 7.6%.
Buyer activity was already thin heading into October. Cotality's September data showed sales over the prior three months 19.1% lower than a year earlier, total capital city listings 23.1% higher, and homes taking a median 39 days to sell, against 23 a year ago. The final combined capital clearance rate fell to 44.1% in the week ending 11 October, the lowest since late June.
Today's rise lifts lender serviceability assessment rates by another 0.25%, which takes another slice off borrowing capacity just as spring selling peaks.
For property investors, gross rental yields reached 3.85% nationally in September, the highest since August 2019, with rents up 5.5% over the year and the vacancy rate at 2.0%.
On most forecasts, national values might be two-thirds of the way through a decline. Today's rise makes it unlikely the trough arrives before mid-2027.
Capital City Housing Performance in October 2026
| Location | Month | Quarter | Annual |
|
Adelaide
|
-1.2% |
-3.9% |
3.7% |
|
Brisbane
|
-2.0% |
-6.1% |
0.4% |
|
Melbourne
|
-0.8% |
-2.7% |
-7.6% |
|
Sydney
|
-1.6% |
-4.7% |
-9.4% |
|
Perth
|
-1.7% |
-5.7% |
3.9% |
|
All Capitals
|
-1.4% |
-4.5% |
-4.8% |
|
All Regionals
|
-0.7% |
-2.0% |
3.4% |
|
National
|
-1.2% |
-3.9% |
-2.8% |
Source: Cotality Home Value Index, as at 31 October 2026.
Interest Rates & Bond Markets
Bond markets eased in October, but not because the inflation story improved. A soft jobs report in mid-October and a tech-led global equity sell-off pushed investors into government bonds. The Australian 10-year yield fell from 5.40% in late September to 5.12% by 30 October.
The front of the curve tells the more important story. The 2-year yield was around 4.90% before the CPI, only a fraction above today's cash rate. The market is pricing a peak, not a series of further rises.
Australia's curve is now close to flat, with a spread of just 0.27% between the cash rate and the 10-year yield, the narrowest in the group below. A flat curve usually means the market expects rates to fall further out. It is the bond market's way of saying the economy will feel this.
|
Country |
Cash Rate | 10 Year | Spread |
| Australia | 4.85% | 5.12% | 0.27% |
| Canada | 2.50% | 3.782% | 1.28% |
| India | 5.50% | 7.41% | 1.91% |
| Japan | 1.25% | 2.78% | 1.53% |
| New Zealand | 2.75% | 4.84% | 2.09% |
| UK | 3.75% | 5.30% | 1.55% |
| USA | 4.00% | 4.93% | 0.93% |
Most central banks held in October, and nearly all of them held with a hawkish lean.
-
US Federal Reserve: held at 4.00% in a 10–2 vote. Markets are now pricing a December rise.
-
Bank of Japan: held at 1.25% and declared underlying inflation consistent with its 2% target for the first time since 2013. Governor Ueda signalled strong prospects for a December hike.Bank of Canada: raised to 2.50%, the first increase since July 2023.
-
Reserve Bank of New Zealand: surprised markets by holding at 2.75% in a 4–3 vote, when a hike had been fully priced.
-
Reserve Bank of India: raised to 5.50%, its first increase in nearly four years, and shifted to a "calibrated tightening" stance.
-
Bank of England: held at 3.75% last month is a 6–3 vote . Markets are pricing a rise for the 5 November meeting.
Australian Shares & Markets
The ASX 200 recovered some ground, closing at 8,908 on 30 October, up 1.3% for the week and about 2.8% above the 8,665 we reported in September. It remains around 4% below its early-August record.
On the morning of the CPI release on 28 October, the index was up 0.9%, but gave all of it back by the close, showing how sensitive the market is to rates. Banks and property stocks recovered the next day after the Fed held. Consumer-facing companies are feeling the squeeze, reflected in Coles flagging pressure on first-half supermarket earnings in its quarterly update.

Equity Markets Worldwide & Global Central Banks
Oil is now the single biggest driver of global rate settings. Brent finished October up 13.6%, its fourth monthly gain in a row. With the US–Israeli war on Iran in its eighth month and attacks on shipping continuing, central banks are holding or hiking to stop an energy shock from turning into embedded inflation.
The tech-led sell-off in global equities through October is a reminder of how much of this year's gains rest on the AI trade. The US midterm elections, held on the same day as today's RBA decision, add another layer of uncertainty for oil and markets over the weeks ahead.
AUD Currency Watch
The Australian dollar has traded either side of 70 US cents through October.
A higher RBA cash rate would normally support the currency, but with the Fed leaning towards another rise and Japan and Canada also tightening, the rate differential has not widened much. For importers, the dollar is holding up, but oil above US$110 is absorbing much of the benefit. For exporters, the picture remains stable.
2026 RBA Monetary Policy Announcements
Thank you for reading Market Watch. The final RBA cash rate announcement for 2026 will be at 2:30pm on Tuesday 8 December.
Follow MCP Financial on LinkedIn for more property and business intel.

Disclaimer: This Market Watch is prepared for general information purposes only and does not constitute financial advice. Figures are drawn from public sources current to 10 August 2026 and may be revised. MCP Financial Services recommends you seek independent advice before making any financial decisions.