


Key Takeaways
- RBA raises to 4.60% - the highest since late 2011.
- Factors to Factor for 2026: August CPI, oil, home values & fixed rates.
- The residential correction is deeper and broader than first reported.
Economy & Property Market Watch - September 2026
Cash Rate Decision
Thanks for reading our sixth Economy & Property Market Watch for 2026.
The RBA has raised the cash rate to 4.60% at its September meeting today. This is the fourth increase this year and ends the pause that began in June and takes the cash rate to its highest level since late 2011.
The move was widely expected. All four major banks had moved to forecast the hike in the fortnight before the meeting, and markets were pricing around a 95% chance of a move to 4.60%, with a possible peak around 5.10%.
Governor Bullock has said upside inflation risks were materialising and warned that higher costs could make inflation more persistent. Her parliamentary appearance alongside the Deputy Governor and two Assistant Governors left many economists firmly convinced the bank would hike.
The Scorecard
"The Scorecard" is updated with available data as of late September 2026. The 'Previous (August)' column reflects the starting position at the last edition.
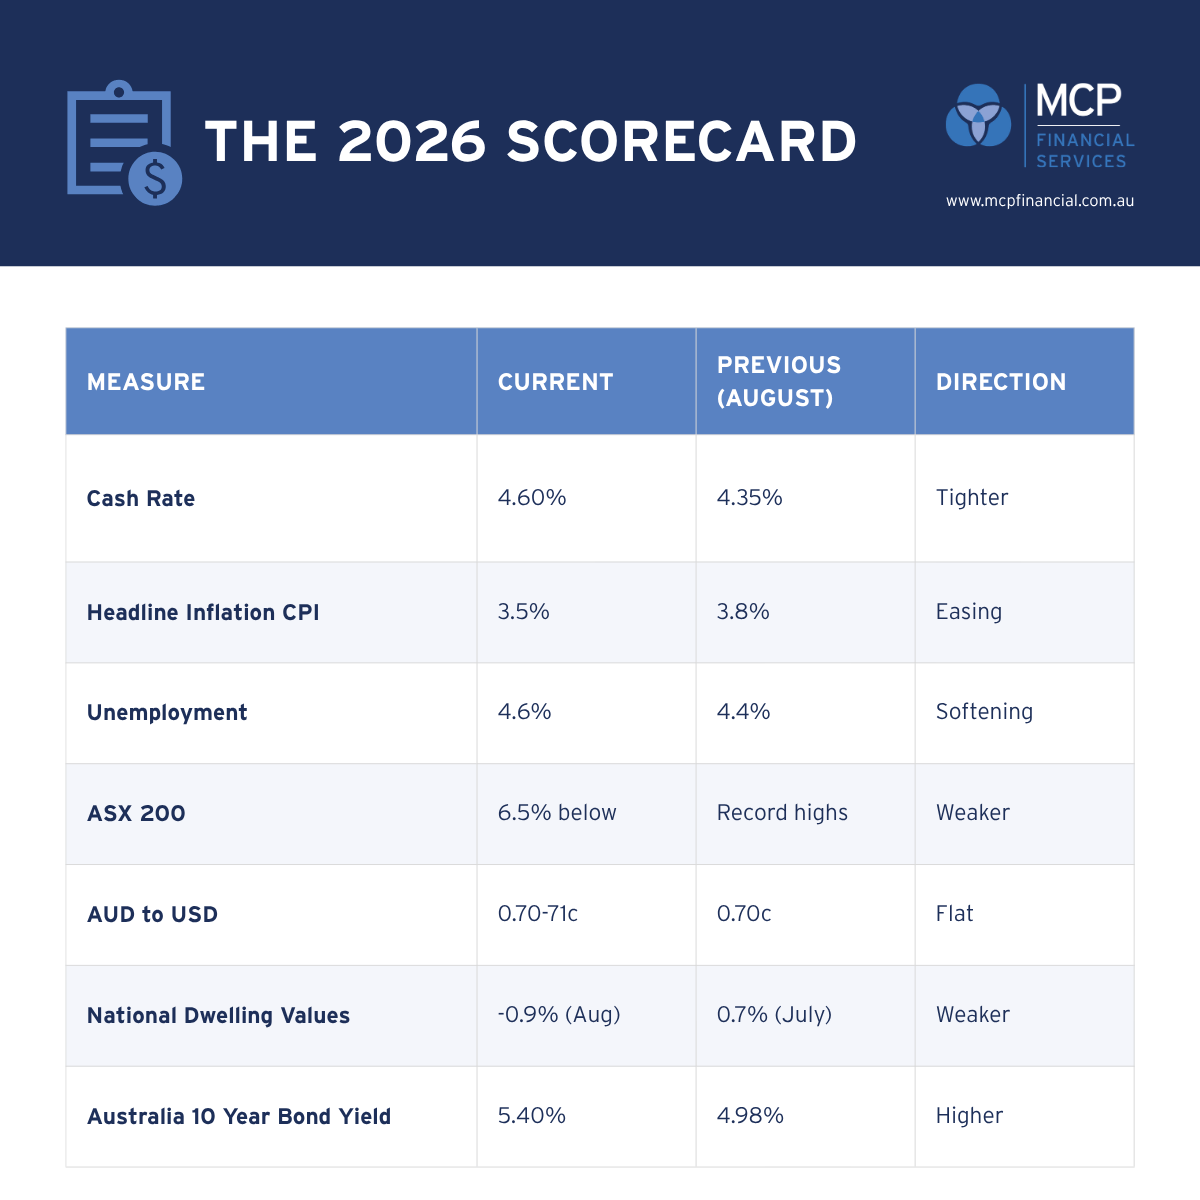
Overall, the picture has turned. In August the labour market and share market were both running ahead of expectations. Since then, unemployment has risen, business conditions have screwed negatively, equities have given back their gains and the housing correction has deepened. The RBA has raised rates anyway, because inflation has not moved.
Interestingly, the average consumer is still spending and perhaps there are some lag effects in play here.
Interest Rates, Inflation & RBA Matters
For borrowers, a 25 basis point increase adds around $90 a month to repayments on a $600,000 loan with 25 years remaining. Here's how to adjust to rising interest rates.
Headline inflation did ease, but the core did not. The CPI rose 3.5% over the 12 months to July, down from 3.8% in June, while trimmed mean inflation remained unchanged at 3.6%. The detail was worse than the headline: the monthly trimmed mean rose 0.5%, the largest rise in a year, leaving annual underlying inflation at 3.6% for a third month.
Expectations are also drifting. Melbourne Institute’s inflation expectations for August came in at 4.9%, unchanged from July and well above the 3.9% recorded a year earlier. Once households expect inflation near 5%, it becomes harder for the Board to look past it.
Meanwhile, rising oil prices have added to the pressure.
The labour market has loosened, but not enough to change the decision. The unemployment rate increased to 4.6% in August, with the number of unemployed people rising 28,200 to 722,900. Full-time employment fell by 6,300 while part-time employment rose by 45,800. The RBA Governor has said that softening is acceptable and an unemployment rate between 4.5% and 5.0% could help cool prices.
June quarter GDP rose 0.4% for the quarter and 2.1% over the year, and real wages have fallen for four consecutive quarters, indicating slowing growth.
Looking to November
The RBA’s next meeting is on 3 November, with three areas to watch:
- The August CPI, released tomorrow, the morning after this decision, and the September CPI before the November meeting.
- Whether oil stays near US$100 per barrel. A de-escalation in the Middle East would remove much of the case for further tightening.
- Will the Board signal that it is done? ANZ is forecasting a second rate rise in November, taking the cash rate to 4.85% by year's end, while CBA describes a further rise to 4.85% as a risk, not its base case, given slowing economic growth, a labour market nearing balance and a significant housing downturn already in progress.
For borrowers, the practical read has changed to "higher for longer, with added risks".

SME Business Conditions
The recovery in business sentiment we reported in August has reversed. In NAB's August Survey, business confidence fell 2 points and remains well below its long-run average. Business conditions fell 5 points and turned negative for the first time in six years. All survey components held steady or fell, with the employment gauge flattened for a second consecutive month.
The drivers are familiar: ongoing global uncertainty, volatility in oil prices and continued cost pressures. A rate rise on top of weakening conditions is the combination that tests cash flow in smaller businesses, particularly in transport, hospitality and construction, where fuel and labour costs bite first.
For business borrowers, this is the time to review covenant headroom, interest cover and working capital facilities, before a lender questions these actions at annual review.
Commercial Property Trends
The funding-cost backdrop has moved against commercial property. With the 10-year bond yield at 5.40% and the cash rate now at 4.60%, the spread between yields and borrowing costs on secondary assets has narrowed further.
Industrial and prime logistics continue to show income resilience, and well-located assets with quality tenants remain sought after. Secondary offices with structural vacancies face further repricing pressure as the risk-free rate climbs. In retail, covenant strength is the key differentiator.
The message from August stands, with more force: serviceability, not valuation growth, is doing the work. Any deal underwritten on a 2027 rate cut should now be stress-tested at a 4.85% cash rate.
For more insights read our latest blog on Investing in Commercial Property.
Residential Property Outlook
The residential correction is deeper and broader than first reported. Cotality's national Home Value Index fell 0.9% in August, a fifth consecutive monthly decline, taking national values 3.6% below the peak recorded in March. July was also worse than the first estimate: the national July print was revised from -0.7% to -1.2%, Perth from +0.1% to -1.3% and Brisbane from -0.6% to -1.2%.
Breadth is the key development. 93% of capital city suburbs recorded a value decline through winter, and Darwin was the only capital still rising. Sydney leads the downturn, down 1.4% in August and 7.1% below its peak.
Last month we noted that borrowing capacity was setting prices, with premium stock falling fastest. That is now spreading: Cotality observes that lower-priced housing is becoming less insulated as affordability pressures and softer demand weigh more evenly across the market. Today's rate rise will lift serviceability assessment rates by the same 25 basis points, which further reduces borrowing capacity.
The market is also reporting fewer buyers. Quarterly sales tracked 15.5% lower than last year, driving total advertised capital city listings 24% higher as homes take longer to sell. The final auction clearance rate for the week ending 30 August was 49.5%, against 69.3% in the same week of 2025.
On the rental front, income continues to improve. The national gross rental yield reached 3.79%, the highest since September 2019, as rents rose 5.7% over the year against falling values.
The forecasters have moved in one direction. CommBank now has national values falling about 9% peak to trough, with Sydney down 13% and Melbourne down 12%, and a trough during 2027. A big watch not just for what it actually means but sentiment across the economy.
Capital City Housing Performance in August 2026
| Location | Month | Quarter | Annual |
|
Adelaide
|
-0.8% |
-1.6% |
8.6% |
|
Brisbane
|
-1.0% |
-2.7% |
10.8% |
|
Melbourne
|
-1.1% |
-3.9% |
-4.7% |
|
Sydney
|
-1.4% |
-4.7% |
-4.6% |
|
Perth
|
-0.8% |
-3.2% |
15.6% |
|
All Capitals
|
-1.1% |
-3.7% |
1.1% |
|
All Regionals
|
-0.4% |
-1.2% |
7.7% |
Source: Cotality Home Value Index, August 2026.
Interest Rates & Bond Markets
The bond market has repriced sharply. The Australian 10-year yield rose to 5.40% on 25 September, up 0.40% over the month and a full 1% higher than a year ago. Earlier in the month, yields reached the highest levels across the curve since May 2011.
The front of the curve tells the same story. On 23 September the 2-year yield was 5.06%, which means the market is pricing a cash rate above today's 4.60% over the next two years.
This is a global move. US and UK 10-year yields are both above 5.1% and we have a decent spread despite rising cash rates. Even after today's increase, Australia has the flattest curve in the group, with a spread of just 0.80% between the cash rate and the 10-year yield. The 10-year is a real watch for the market’s mood.
|
Country |
Cash Rate | 10 Year | Spread |
| Australia | 4.60% | 5.40% | 0.80% |
| Canada | 2.25% | 3.92% | 1.67% |
| India | 5.25% | 7.12% | 1.87% |
| Japan | 1.25% | 3.07% | 1.82% |
| New Zealand | 2.75% | 5.13% | 2.38% |
| UK | 3.75% | 5.36% | 1.61% |
| USA | 4.00% | 5.17% | 1.17% |
The US Federal Reserve has joined the tightening, voting 12-0 to lift the funds rate to a range of 3.75% to 4.00%, its first increase in more than three years, with the expectation of one more rate hike this year.
The Bank of Japan raised its policy rate by 25 basis points to 1.25%, a 31-year high, and the Reserve Bank of New Zealand also lifted by 25 basis points to 2.75%. The Bank of England was the exception, holding at 3.75%.
Australian Shares & Markets
The August records failed to hold and the ASX 200 fell to 8,665 on 25 September, down 5% over the past month, and was set for a fourth straight weekly decline. That leaves the index roughly 6.5% below its record close of around 9,270 in early August.
Rising bond yields and oil prices drove the sell-off. On 24 September, Brent was at US$103 a barrel, and the consumer discretionary sector declined as expectations factored in that the RBA would raise rates. The major banks have held up better, supported by margins, but the housing correction continues to weigh on the credit outlook.

Equity Markets Worldwide & Global Central Banks
The global backdrop has quickly shifted from easing to tightening and most modern countries have raised rates. The Bank of England has three of nine members already voting to hike, and bond yields in the US, UK and Australia are at multi-decade highs. US equities pulled back slightly after the Fed press conference as the market digested the possibility of a more restrictive policy path.
Oil remains the swing factor for every central bank. A Middle East settlement would work to ease inflation pressure, while further supply disruption will keep tightening on the table.
AUD Currency Watch
The Australian dollar has been volatile. It reached three-month highs at 72 US cents in early September, before sliding below 71 US cents as the US dollar strengthened over the month.
A higher RBA cash rate would normally support the currency, but with the Fed and the RBNZ also hiking, the rate differential has not widened. For importers, the dollar continues to offer relief on USD input costs, although higher oil prices are absorbing much of that benefit. For exporters, the picture remains stable.
Factors to Factor
The August CPI lands tomorrow, 30 September, the morning after this decision. A strong result would put November firmly in play.
Cotality's September Home Value Index is released on 1 October and will show whether August's figures are also revised down.
For clients with fixed rates rolling off, the timing matters. NAB and ANZ raised their fixed rates ahead of this meeting, so the cost of certainty has already moved. Clients refinancing or approaching expiry should have that conversation now rather than at rollover.
For investors, remember that the new SMSF rules and the changes to negative gearing for established dwellings acquired after 12 May 2026 continue to reshape the investor market. Read more on the new SMSF rules.
The worry is ongoing inflation from supply shocks and pressure. Better inflation comes from demand where the consumer spends, businesses invest, wages grow, and prices follow with this growth. We explore this further in our latest blog - Australia's Debt Part 1 - At What Cost?
2026 RBA Monetary Policy Announcements
Thank you for reading Market Watch. The next RBA cash rate announcements will be at 2:30pm on the following Tuesdays in 2026:
3 November8 December
Follow MCP Financial on LinkedIn for more property and business intel.

Disclaimer: This Market Watch is prepared for general information purposes only and does not constitute financial advice. Figures are drawn from public sources current to 10 August 2026 and may be revised. MCP Financial Services recommends you seek independent advice before making any financial decisions.