


It's 2026, and global government debt is climbing. How does Australia's position compare?
In Part One, Australia’s Debt – At What Cost?, we compared the IMF's April 2026 World Economic Outlook against Australia's position. We reached a ‘comfortable’ conclusion that at 51.0% of GDP, Australian government debt is roughly half the advanced-economy average of 108%. Australia is also one of the few countries in the developed world whose debt the IMF has viewed as heading down over the decade.
Household balance sheets hold the debt
Household debt is primarily driven by housing, with investors and owner-occupiers both contributing as holders of residential mortgages. Therefore, large housing stocks are held against a far larger asset base.
| Measure | At September 2026 |
| Total Household Debt (ABS) | $3.454bn |
| Household Net Worth (ABS) | $19.212bn |
| Debt to Disposable Income (APRA) | Approx. 180% |
| Debt to GDP - second highest in the world | Approx. 112% |
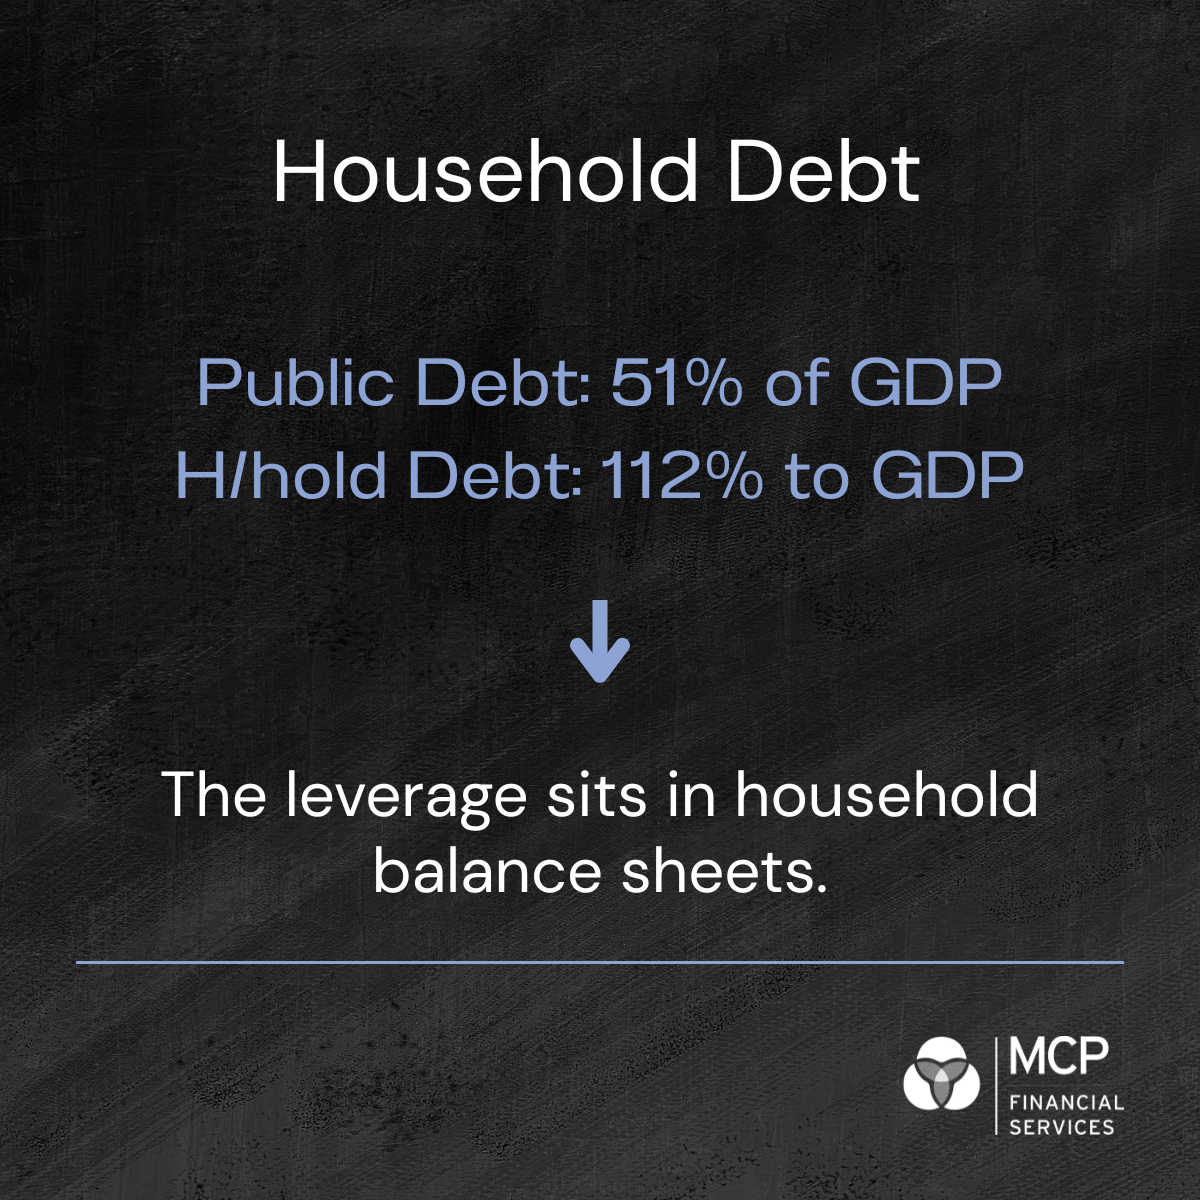
If public debt sits at 51% of GDP and household debt sits at 112%, it appears that Australia does not have a capital problem – it has an income problem.
In other words, the leverage didn’t disappear, but instead, it shifted into household balance sheets.
Why low gearing confuses the diagnosis
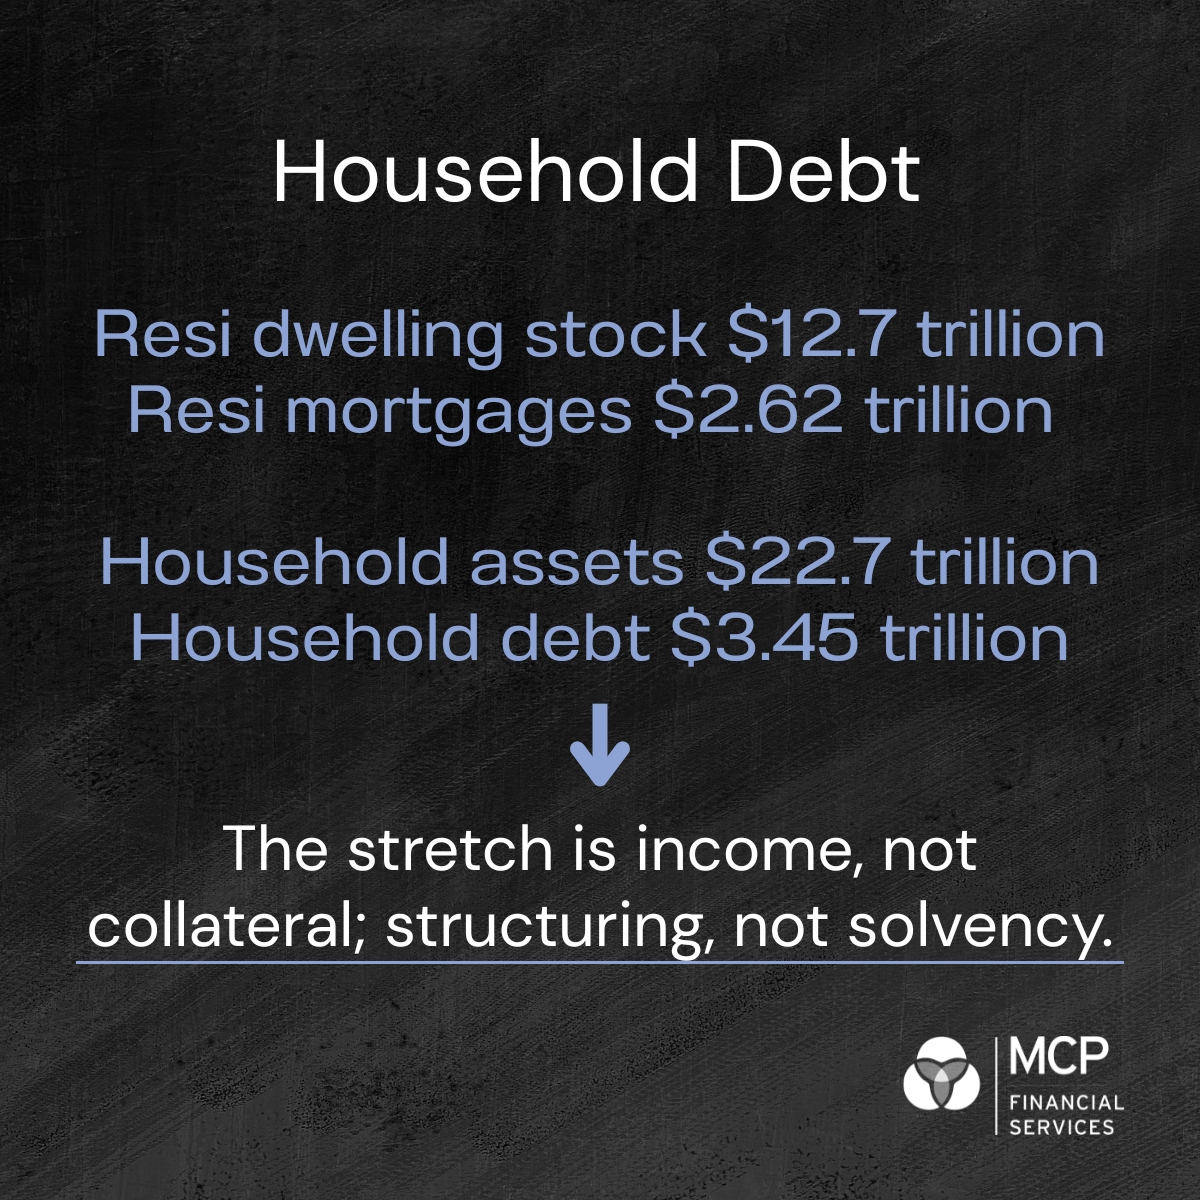
As of June 2026, Australia's residential dwelling stock was worth around $12.7 trillion, up around 11% over the year. The residential mortgage book portion of this is around $2.63 trillion. This will fall a little with up to date data.
≈20% system-wide loan-to-valuation ratio
Across the whole household balance sheet, debt is around 15% of gross assets or $3.45 trillion of liabilities against approximately $22.7 trillion of assets. Around 83% of new lending is at a Loan to Value Ratio (LVR) of 80% or below, and households in negative equity sit below 1%.
Conservative gearing by comparison
When total residential mortgage debt is measured against the total value of the housing stock, Australia sits at the low end of comparable economies.
| Country | Aggregate LVR |
| Australia | 20.0% |
| United Kingdom | 19.0% |
| Canada | 25.7% |
| United States | 28.4% |
Each country's figures come from a different statistical agency, so the ranking is sound, but the decimal places are not. Australia's figure counts bank lending only; adding non-bank lenders lifts it to roughly 20%. All four measures include unencumbered homes, and flatten the borrower-level picture to the same degree.
Even though our gearing is low, Australia carries the second-highest household debt-to-GDP ratio in the world. We have stretched the nexus between income and asset values. These two facts are related: the debt is large because the assets are expensive, and the gearing is low for the same reason.
The Household Income Problem
Higher house prices inflate the numerator and the denominator together, but they inflate the denominator faster. So, Australia does not have a “solvency” problem. It has an income problem, secured against high-value assets.
In a business context, aggregated household balance sheets are strong, but the profit & loss accounts are weak. The risk that exists here is that asset values can change quickly.
The income problem is resolved by cash flow and by making changes to the structure, efficiency or output of cash. While prudent, these adjustments can take time to have any material impact.
Gearing is only low while the denominator holds
Every comfortable number above - the 20% system LVR, the sub-1% negative equity, the intact buffers - is a function of asset values. A sustained correction in dwelling values doesn’t impact repayment obligations, but it erodes the very route that makes an income problem survivable.
One honest caveat on the aggregate figure here: A system-wide LVR flatters the borrower-level picture, because the dwelling stock includes a large body of homes that carry no mortgage at all. The borrowers who are geared are more concentrated than 19% implies, and this is why distribution matters more than the average.
2026's servicing burden is more than ever
KPMG’s analysis of RBA data shows that interest repayments reached 5.4% of household income in 2026, against a recent peak of 5.9% in December 2023. Even at the peak of the 1989-90 cycle, when the cash rate hit 17.5%, the figure was 5.7%. Any material rate increases from here will stretch matters further.
A heavier burden at 4.35% than at 17.5%
Today, loans are larger relative to income. Because the debt base is so much bigger, a 25 basis point move today does roughly what a full percentage point did in 1990. This is why the RBA moves in such small increments, and why "higher for longer" is a materially different proposition in Australia than, say, in the United States.
Averages are hiding a tail
Households feel mortgage stress disproportionately. While arrears among highly leveraged and lower-income borrowers have improved, it remains materially above every other cohort, causing a tail at this end of the story.
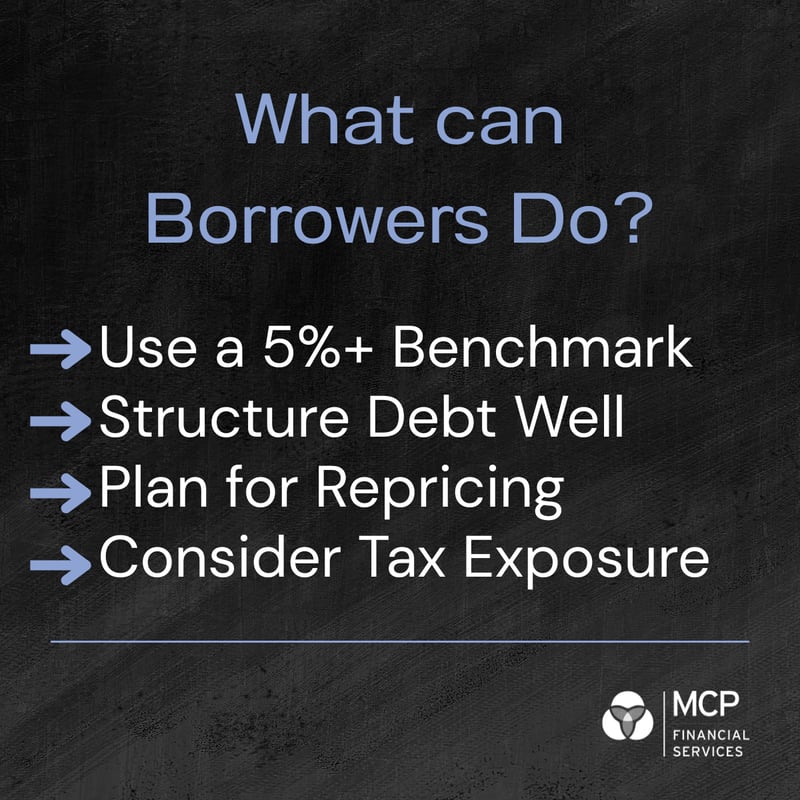
What can Borrowers Do?
1. Stress-test at the buffer, not the headline rate
Small moves are impactful upon a large debt base. Therefore, households must model the 3-5 percentage point serviceability buffer as a live scenario, not a regulatory formality.
2. Recognise that debt has become a capacity question
Businesses and Households have less capacity to retire debt out of income; rather, it is capital flows that will drive debt reduction.
3. Resolve overdue debt
For example, unpaid credit card or tax debt is visible, reportable and treated as a credit signal that is far easier to address in advance than it is to explain later.
The bottom line
The Australian Government does not carry the leverage, but its households do. Public debt at 51% of GDP against household debt at 112% is a transfer. Therefore, global rate repricing reaches Australian kitchens and boardrooms considerably faster than it reaches Canberra.
The good news is that this is a structuring problem, not a solvency one. The debt is conservatively geared at roughly 20% of the value of the housing stock and around 15% of household assets, with buffers intact, arrears low and a small, identifiable tail.
The principle of retiring debt out of income is an important one for sustainable economies long term and is a first line of defence.
Australians are stretched on income, not on collateral.
Which is also the caveat. That entire assessment is underwritten by asset values holding steady. Despite some recent wobbles, values have held for a long time, and Australians should not take that for granted.
Contact MCP
1300 510 816 or your Finance Partner
enquiry@mcpfinancial.com.au
This article is general information only and does not consider any person’s objectives, financial situation or needs.
Sources: ABS, Australian National Accounts: Finance and Wealth, March 2026; ABS, Total Value of Dwellings, March quarter 2026; APRA, Quarterly ADI Property Exposure Statistics; US Federal Reserve, Financial Accounts of the United States (Z.1), Q1 2026; UK Financial Conduct Authority, Mortgage Lending Statistics, June 2026, and Savills UK housing stock estimate, February 2026; Statistics Canada, National Balance Sheet Accounts, Q1 2026, and CMHC; APRA, System Risk Outlook, May 2026; APRA, debt-to-income limits announcement, 27 November 2025; RBA, Financial Stability Review, March 2026; RBA, Monetary Policy Decision, 5 May 2026; KPMG, Households facing some of the heaviest home loan interest repayment burdens on record, July 2026; IMF Fiscal Monitor and World Economic Outlook, April 2026.