July 2023: Rate Decision & Economy
The Reserve Bank of Australia (RBA) has today announced no change to the official cash rate, leaving it at 4.10%.
The balance is getting hard to find amid the strain of households and parts of the macro economy, against other stimulating economic factors. There are also signs that demand is starting to soften, including a softer set of retail spending data and a rise in mortgage arrears levels.
However, the unemployment rate, at 3.6%, shows the strength of the labour market which is well below the RBA’s traditional measure of full employment (circa 4.5%). The property market is another stimulate with constrained supply and rising demand from migration growth for example.
Economic Sentiment
According to Australian Bureau of Statistics’ data, inflation fell materially from 6.8% to 5.6% in May from 6.8% in April, according to the monthly CPI which was lower than expected. However the quarterly CPI result released in July, will be the one that the RBA has its eye on for a source for long term direction.
Overseas, the US is trying to cool their economy while still aiming to control inflation. There is strong sentiment about risks and economic downturn, but the data is telling a different story. As are US equity markets.
Consumer Sentiment Subdued
Despite an increase last week, the ANZ-Roy Morgan Consumer Confidence index was at 74.9. The number itself may mean nothing, but it has now spent 17 weeks below the index of 80 – the longest period since it was captured on a weekly basis in 2008. More conflicting data.
RBA Stance
Despite risks of economic downturn, inflation is not falling fast enough to prevent the RBA from continuing to maintain interest rate settings. Even with the rise in June, RBA Governor Dr Lowe position was a little softer last month:
“The Board is still seeking to keep the economy on an even keel as inflation returns to the 2–3% target range, but the path to achieving a soft landing remains a narrow one. A significant source of uncertainty continues to be the outlook for household consumption. The combination of higher interest rates and cost-of-living pressures is leading to a substantial slowing in household spending.”
This is a subtle change in tone.
Shares & Markets
With the financial year finished, it is surprising to reflect that the market rose over 10% in the last 12 months, despite a lot of volatility. There is division among commentators on what will happen in Financial Year 2024. Many are predicting softness for six or so months followed by a recovery.
Overall for June the All Ordinaries was a gain, reversing some of the softness in May.
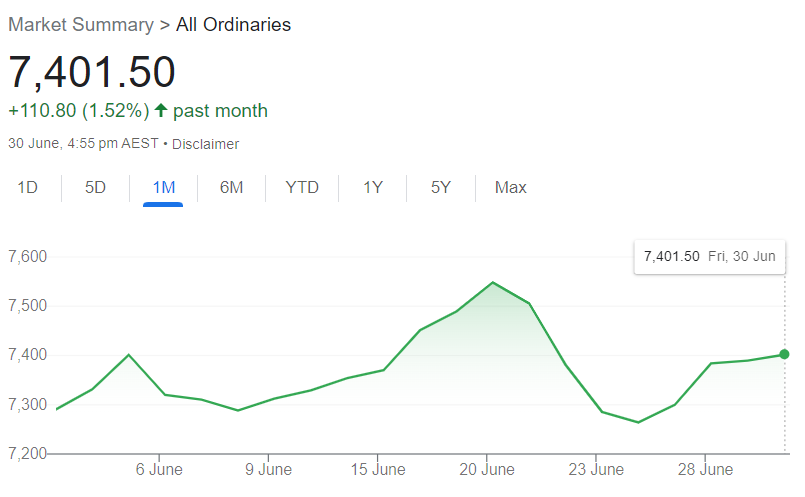
Comparatively, Australian markets being up only 16% over 5 years might be cheap... or the US is heading for a fall. Depends which side of the coin you see.
Direction for Local Interest Rates?
Well the market has caught up to the economists.
Insights from the ASX Cash Rate Futures, gauging month to month expectations regarding a destination for the peak cash rate. The shape of the curve has changed, with a sharp increase in expectations (circa 60 points), with the market expecting a peak by the end of the year.
This is indicated by the ASX Cash Rate Futures as below.
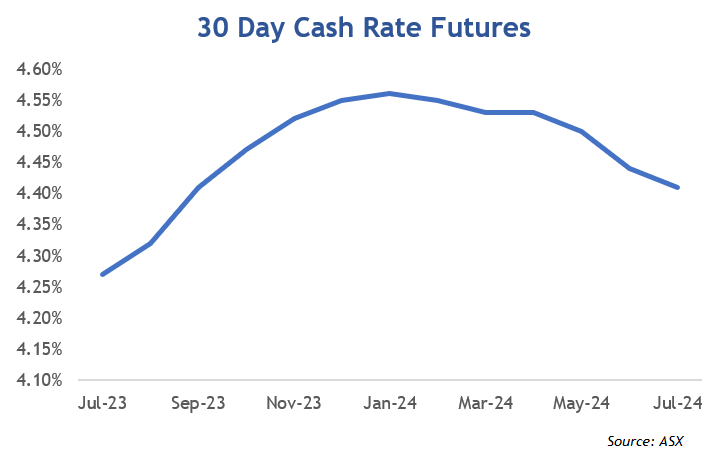
Financial markets still imply that the cash rate will fall over the coming 12 months but off a larger peak. If this concept is confusing, focus on the shape of the curve.
Update for Interest Rates Worldwide
Again, long-term rates continued to increase as the world revised expectations around interest rate settings. More than ever, we are seeing economies at different stages of their cycles.
New Zealand's central bank looks to be at the end of the tightening cycle with rates out to 5.50%. The local economy has technically fallen into recession with a negative quarter of growth. The tough medicine sees interest rates at a 14-year high and the following period could be a roadmap for other economies.
In the UK, the Bank of England moved with a strong 50 point rise and alluded there is more to come. Now at 5%, which is the highest since 2008, headline inflation is 8.7% and core inflation is not showing the signs of settling down.
The U.S. kept rates unchanged at 5.25% for the first time in a while, allowing a pause to see how the economy copes over months ahead. The Fed remains clear that inflation management is a priority.
Canada after a four month pause raised rates by 25 points to a 22-year high level of 4.75%, citing strong household spending and inflation despite showing signs of stalling. Their curve is still heavily inverted.
Eurozone increased rates for the time in a row, and signalled there may be more tightening to follow.
Central Bank Cash Rates
Before posting any changes today we compare central bank cash rates and their longer term 10-year bond yields.
The movement this month was at all ends of the yield curve with increases in short-term money matched by longer term. The spread in most countries remains inverted, some more than others.
| Country |
Cash Rate | 10 Year Bond | Spread |
|
Australia
|
4.10% | 4.03% | -0.07% |
|
Canada
|
4.75% | 3.41% | -1.34% |
|
China
|
3.55% | 2.69% | -0.86% |
| Germany | 4.00% | 2.42% | -1.58% |
| India | 6.50% | 7.11% | 0.61% |
| Japan | -0.10% | 0.40% | 0.50% |
| New Zealand | 5.50% | 4.68% | -0.82% |
| Singapore | 3.78% | 3.08% | -0.70% |
| United Kingdom | 5.00% | 4.49% | -0.51% |
| United States | 5.25% | 3.88% | -1.37% |
For example, Germany’s 10-year yield, compare to short term and 2 year rates, is the most inverted as it has been for 30 years.
Local Money Markets
Australian money markets were active and yields rose across all terms. The June 25-point rise was in line with expectation and was a further uplift across all terms, but with a premium to reflect more rises ahead.
| Month | Cash Rate | 180 Day | 10 Year |
|
Aug 22
|
1.85% |
2.78% |
2.96% |
|
Sep 22
|
2.35% |
3.04% |
3.65% |
|
Oct 22
|
2.60% |
3.55% |
3.90% |
|
Nov 22
|
2.85% |
3.61% |
3.74% |
|
Dec 22
|
3.10% |
3.48% |
3.48% |
|
Feb 23
|
3.35% |
3.67% |
3.50% |
|
Mar 23
|
3.60% |
3.94% |
3.85% |
|
Apr 23
|
3.60% |
3.81% |
3.30% |
|
May 23
|
3.85% |
3.82% |
3.34% |
|
June 23
|
4.10% |
4.21% |
3.65% |
|
July 23
|
4.10% |
4.67% |
4.03% |
The momentum for interest rates is now consistent at all ends of the curve. The 180-day rate and 10-year rate rose in alignment based on changed expectations about the direction of interest rates.
Residential Property
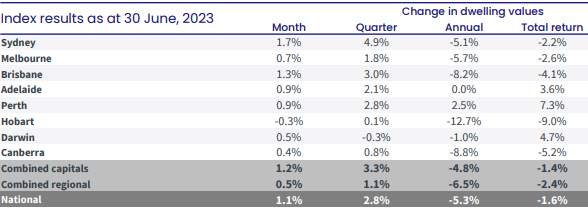
The latest residential monthly property results from CoreLogic showed home values up over 1% nationally in June 2023 which was the strongest result for some time.
Again, a low level of available supply continues to be the main driver in the value of properties, despite the rising interest rate environment.
Sydney led the overall increase and capital city growth has well and truly outstripped regional growth.
Commercial Market
A good watch for the broader economy is the state of the commercial property market. The headline is that rents are softer, with the Melbourne CBD leading the way here, so incentives are very strong.
The focus will turn to how this sector holds up over into 2024 as rates rise and yields soften.
Currency
The Australian dollar recovered ground against the USD in particular and was stronger against a majority of other currencies. Our interest rates starting to catch up with the world is having a positive impact on pricing.
Our currency level is very relevant right now, with a balance to be found between keeping our exports competitive and ensuring that it is strong enough to keep the price of essential imports in check.
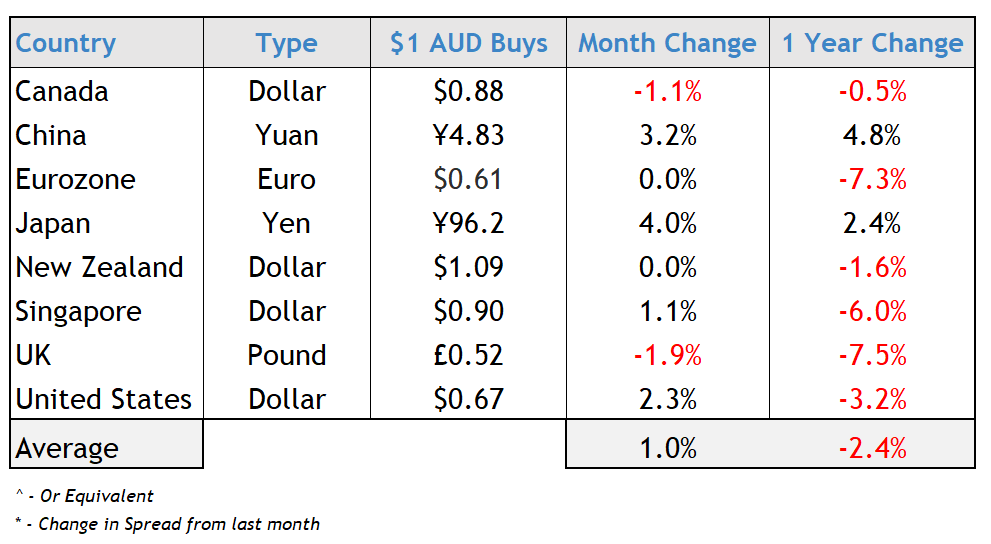
These trends are challenging for the RBA. While we have discussed here the benefit of a weaker currency for our exports, in the short-term it can typically add to inflationary pressures by making non-discretionary imports more expensive.
We wish you a prosperous July.
